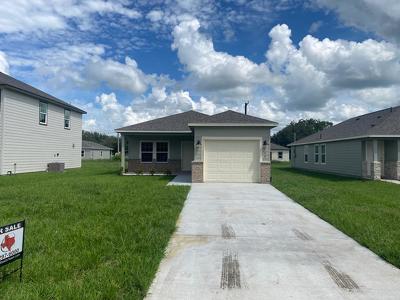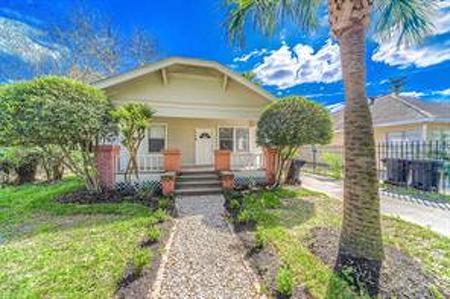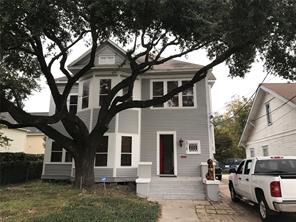
Buy & Flip |
|
$21,996Net Profit |
21.55%ROI |
Total Cash Investment
Holding Period
Rehab/Renovation Costs
After Repair Value (ARV)
Financing Type
Risk Level
Net Profit
Annualized ROI
Return-On-Investment
Total Loan Cost
Monthly Loan Interest
Cost Per Month
Cost Per Week
Cost Per Day
Cost of Points
Monthly Expenses
Month |
Arv |
Total Cash Investment |
Total Loan Cost |
Net Profit |
Roi |
|---|---|---|---|---|---|
| 0 | $130,000 | $98,777 | $1,589 | $29,634 | 30% |
| 1 | $130,000 | $99,322 | $2,317 | $28,361 | 28.55% |
| 2 | $130,000 | $99,866 | $3,046 | $27,088 | 27.12% |
| 3 | $130,000 | $100,411 | $3,774 | $25,815 | 25.71% |
| 4 | $130,000 | $100,956 | $4,503 | $24,541 | 24.31% |
| 5 | $130,000 | $101,501 | $5,231 | $23,268 | 22.92% |
| 6 | $130,000 | $102,045 | $5,959 | $21,996 | 21.55% |
| 7 | $130,000 | $102,590 | $6,688 | $20,722 | 20.20% |
| 8 | $130,000 | $103,135 | $7,416 | $19,449 | 18.86% |
| 9 | $130,000 | $103,679 | $8,144 | $18,177 | 17.53% |
| 10 | $130,000 | $104,224 | $8,873 | $16,903 | 16.22% |
| 11 | $130,000 | $104,769 | $9,601 | $15,630 | 14.92% |
| 12 | $130,000 | $105,314 | $10,329 | $14,357 | 13.63% |
Disclaimer: This report is intended for general guidance and information purposes only. The report provides estimates of the potential earnings or... read more
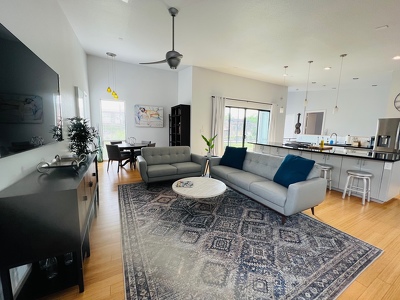
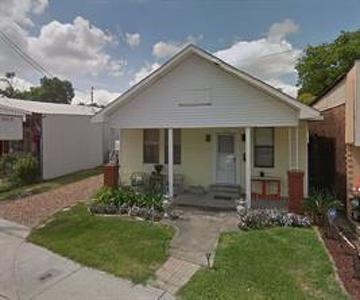
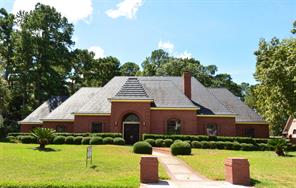
Buy & Flip |
|
$28,460Net Profit |
28.03%ROI |
Total Cash Investment
Holding Period
Rehab/Renovation Costs
After Repair Value (ARV)
Financing Type
Risk Level
Net Profit
Annualized ROI
Return-On-Investment
Total Loan Cost
Monthly Loan Interest
Cost Per Month
Cost Per Week
Cost Per Day
Cost of Points
Monthly Expenses
Month |
Arv |
Total Cash Investment |
Net Profit |
Roi |
|---|---|---|---|---|
| 0 | $130,000 | $98,272 | $31,728 | 32.29% |
| 1 | $130,000 | $98,817 | $31,183 | 31.56% |
| 2 | $130,000 | $99,361 | $30,639 | 30.84% |
| 3 | $130,000 | $99,906 | $30,094 | 30.12% |
| 4 | $130,000 | $100,451 | $29,549 | 29.42% |
| 5 | $130,000 | $100,996 | $29,004 | 28.72% |
| 6 | $130,000 | $101,540 | $28,460 | 28.03% |
| 7 | $130,000 | $102,085 | $27,915 | 27.34% |
| 8 | $130,000 | $102,630 | $27,370 | 26.67% |
| 9 | $130,000 | $103,174 | $26,826 | 26% |
| 10 | $130,000 | $103,719 | $26,281 | 25.34% |
| 11 | $130,000 | $104,264 | $25,736 | 24.68% |
| 12 | $130,000 | $104,809 | $25,191 | 24.04% |
Disclaimer: This report is intended for general guidance and information purposes only. The report provides estimates of the potential earnings or... read more
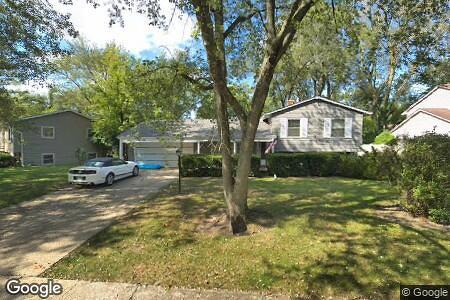
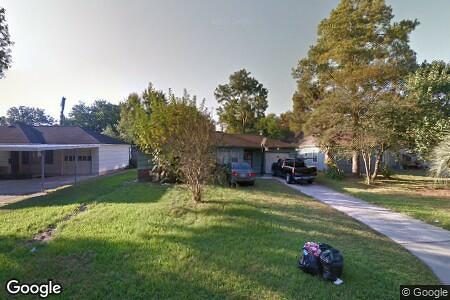
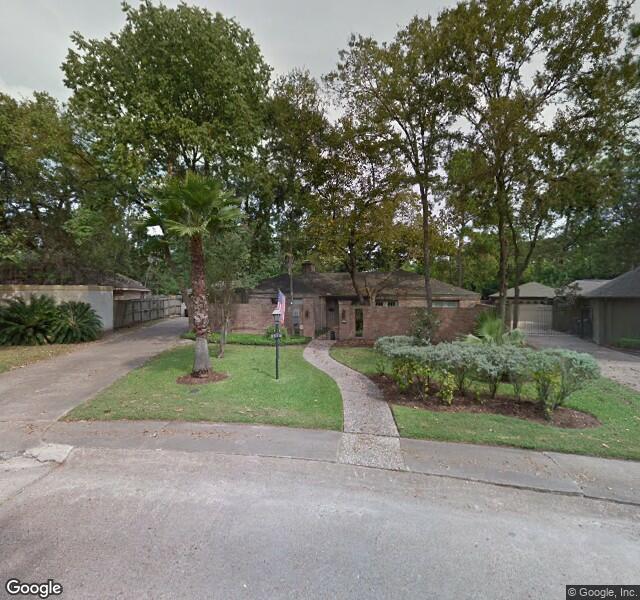
Rental |
|
69.66%Cash-on-Cash Return Annually |
$4,577Avg. Cashflow Annually |
Total Investment
Point of Sale
Monthly Income
Monthly Expenses
Financing Type
Cash-on-Cash Return
Avg. Annual Cashflow
Appreciated Home Value
Total Net Cashflow
Total ROI at Sale
Equity
Monthly Payment
Total Amount Paid
Total Principal Paid
Total Interest Paid
Disclaimer: This report is intended for general guidance and information purposes only. The report provides estimates of the potential earnings or... read more
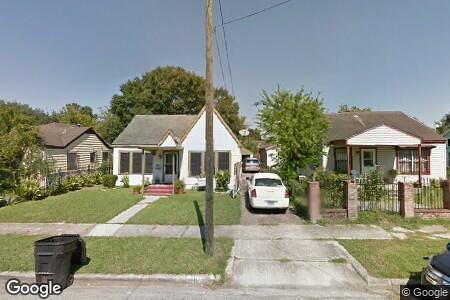
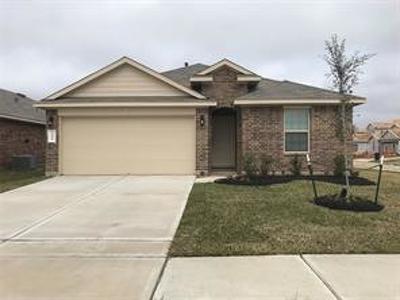
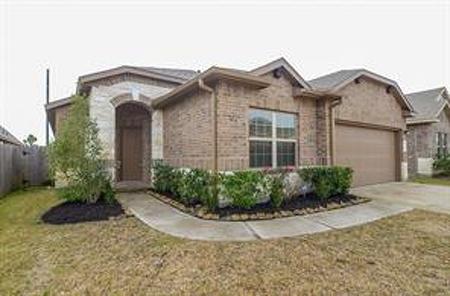
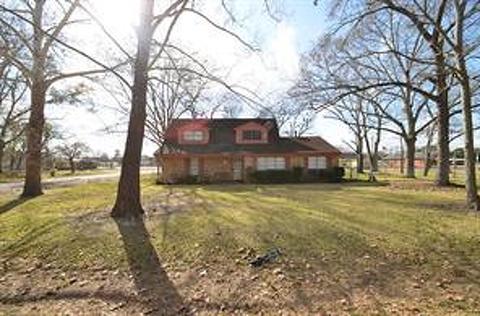
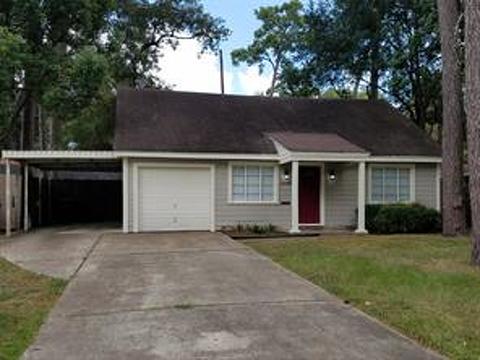
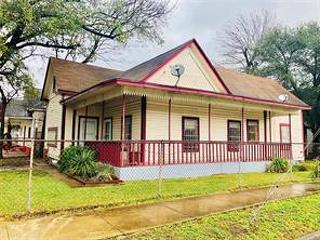
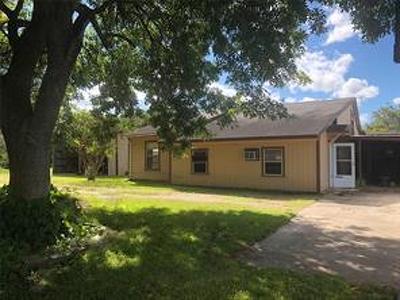
Property Details |
||
Property Type: |
Single-Family |
|
Bed(s): |
2 |
|
Full-Bath(s): |
1 |
|
Half-Bath(s): |
0 |
|
Building Sqft: |
||
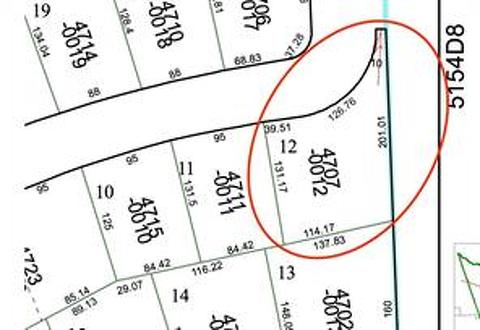
Lot Size: |
16640 |
|
Tax Rate: |
2.2478 |
|
County: |
Wharton |
Listing Information |
|
List Price: |
$50,560 |
List Status: |
Sold |
MLS Number: |
2668978 |
Days on Market: |
79 |
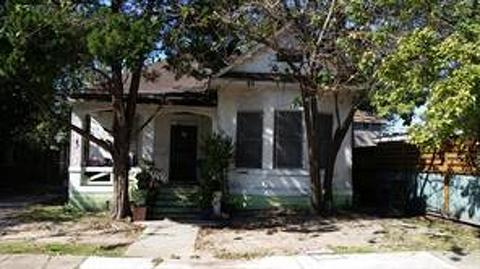
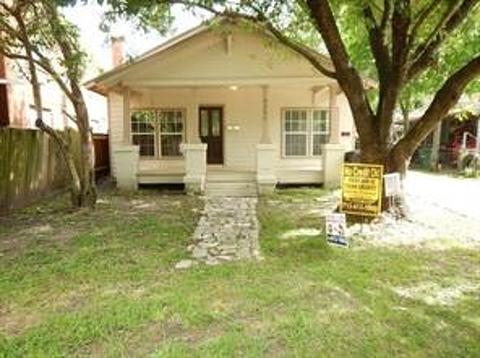
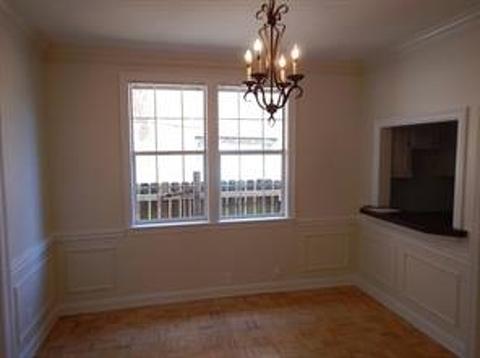
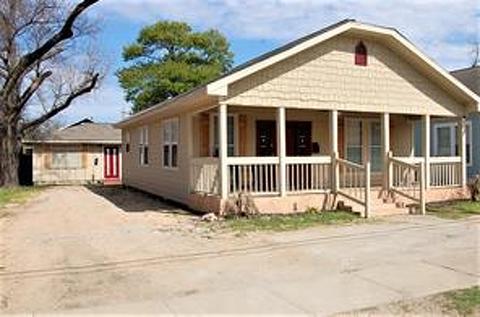
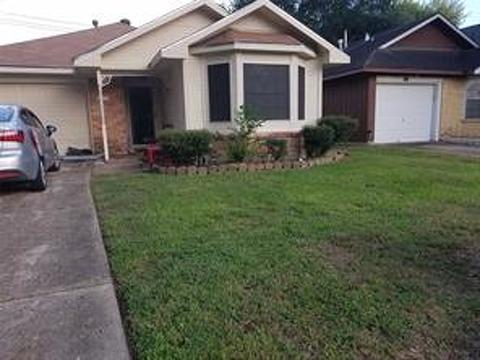
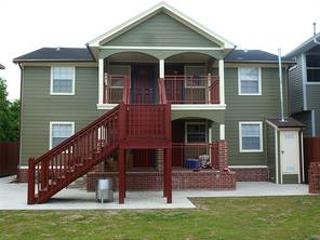
The house was flooded in Harvey so probably needs to be torn down or completely remodeled. It’s a two bedroom, one bath with a kitchen, formal dining room, mud room and covered patio.