Buy & Flip |
|
$-55,683Net Profit |
-11.60%ROI |
Total Cash Investment
Holding Period
Rehab/Renovation Costs
After Repair Value (ARV)
Financing Type
Risk Level
Net Profit
Annualized ROI
Return-On-Investment
Total Loan Cost
Monthly Loan Interest
Cost Per Month
Cost Per Week
Cost Per Day
Cost of Points
Monthly Expenses
Month |
Arv |
Total Cash Investment |
Total Loan Cost |
Net Profit |
Roi |
|---|---|---|---|---|---|
| 0 | $450,000 | $472,250 | $6,843 | $-29,093 | -6.16% |
| 1 | $450,000 | $473,545 | $9,979 | $-33,524 | -7.08% |
| 2 | $450,000 | $474,841 | $13,116 | $-37,957 | -7.99% |
| 3 | $450,000 | $476,136 | $16,252 | $-42,388 | -8.90% |
| 4 | $450,000 | $477,431 | $19,388 | $-46,819 | -9.81% |
| 5 | $450,000 | $478,726 | $22,525 | $-51,251 | -10.71% |
| 6 | $450,000 | $480,022 | $25,661 | $-55,683 | -11.60% |
| 7 | $450,000 | $481,317 | $28,797 | $-60,114 | -12.49% |
| 8 | $450,000 | $482,612 | $31,934 | $-64,546 | -13.37% |
| 9 | $450,000 | $483,908 | $35,070 | $-68,978 | -14.25% |
| 10 | $450,000 | $485,203 | $38,206 | $-73,409 | -15.13% |
| 11 | $450,000 | $486,498 | $41,343 | $-77,841 | -16% |
| 12 | $450,000 | $487,793 | $44,479 | $-82,272 | -16.87% |
Disclaimer: This report is intended for general guidance and information purposes only. The report provides estimates of the potential earnings or... read more
Buy & Flip |
|
$74,052Net Profit |
21.01%ROI |
Total Cash Investment
Holding Period
Rehab/Renovation Costs
After Repair Value (ARV)
Financing Type
Risk Level
Net Profit
Annualized ROI
Return-On-Investment
Total Loan Cost
Monthly Loan Interest
Cost Per Month
Cost Per Week
Cost Per Day
Cost of Points
Monthly Expenses
Month |
Arv |
Total Cash Investment |
Total Loan Cost |
Net Profit |
Roi |
|---|---|---|---|---|---|
| 0 | $450,000 | $346,250 | $6,251 | $97,499 | 28.16% |
| 1 | $450,000 | $347,293 | $9,116 | $93,591 | 26.95% |
| 2 | $450,000 | $348,335 | $11,982 | $89,683 | 25.75% |
| 3 | $450,000 | $349,378 | $14,847 | $85,775 | 24.55% |
| 4 | $450,000 | $350,421 | $17,712 | $81,867 | 23.36% |
| 5 | $450,000 | $351,463 | $20,577 | $77,960 | 22.18% |
| 6 | $450,000 | $352,506 | $23,442 | $74,052 | 21.01% |
| 7 | $450,000 | $353,549 | $26,307 | $70,144 | 19.84% |
| 8 | $450,000 | $354,591 | $29,173 | $66,236 | 18.68% |
| 9 | $450,000 | $355,634 | $32,038 | $62,328 | 17.53% |
| 10 | $450,000 | $356,677 | $34,903 | $58,421 | 16.38% |
| 11 | $450,000 | $357,719 | $37,768 | $54,513 | 15.24% |
| 12 | $450,000 | $358,762 | $40,633 | $50,605 | 14.11% |
Disclaimer: This report is intended for general guidance and information purposes only. The report provides estimates of the potential earnings or... read more
Buy & Flip |
|
$-55,683Net Profit |
-11.60%ROI |
Total Cash Investment
Holding Period
Rehab/Renovation Costs
After Repair Value (ARV)
Financing Type
Risk Level
Net Profit
Annualized ROI
Return-On-Investment
Total Loan Cost
Monthly Loan Interest
Cost Per Month
Cost Per Week
Cost Per Day
Cost of Points
Monthly Expenses
Month |
Arv |
Total Cash Investment |
Total Loan Cost |
Net Profit |
Roi |
|---|---|---|---|---|---|
| 0 | $450,000 | $472,250 | $6,843 | $-29,093 | -6.16% |
| 1 | $450,000 | $473,545 | $9,979 | $-33,524 | -7.08% |
| 2 | $450,000 | $474,841 | $13,116 | $-37,957 | -7.99% |
| 3 | $450,000 | $476,136 | $16,252 | $-42,388 | -8.90% |
| 4 | $450,000 | $477,431 | $19,388 | $-46,819 | -9.81% |
| 5 | $450,000 | $478,726 | $22,525 | $-51,251 | -10.71% |
| 6 | $450,000 | $480,022 | $25,661 | $-55,683 | -11.60% |
| 7 | $450,000 | $481,317 | $28,797 | $-60,114 | -12.49% |
| 8 | $450,000 | $482,612 | $31,934 | $-64,546 | -13.37% |
| 9 | $450,000 | $483,908 | $35,070 | $-68,978 | -14.25% |
| 10 | $450,000 | $485,203 | $38,206 | $-73,409 | -15.13% |
| 11 | $450,000 | $486,498 | $41,343 | $-77,841 | -16% |
| 12 | $450,000 | $487,793 | $44,479 | $-82,272 | -16.87% |
Disclaimer: This report is intended for general guidance and information purposes only. The report provides estimates of the potential earnings or... read more
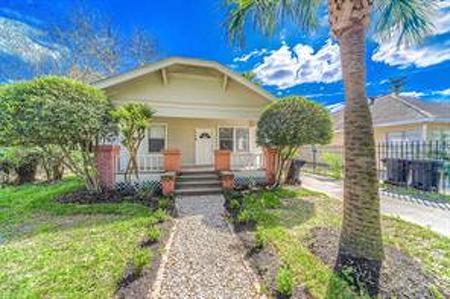
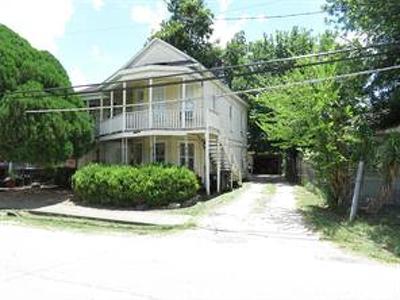
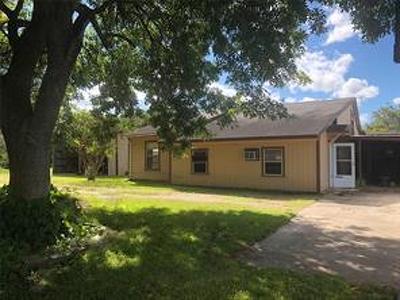
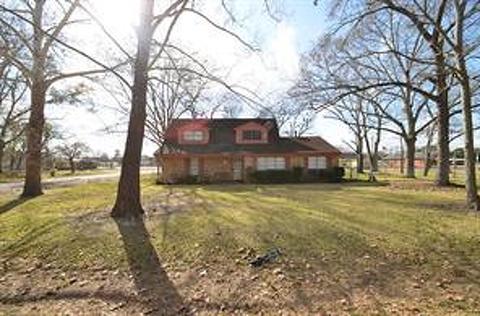
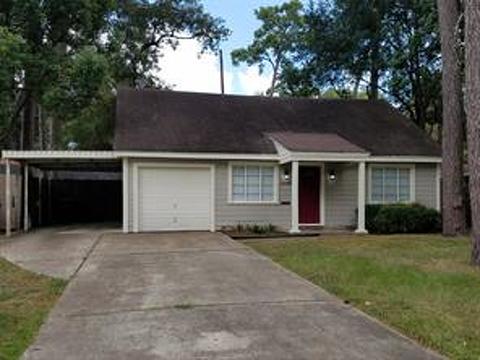
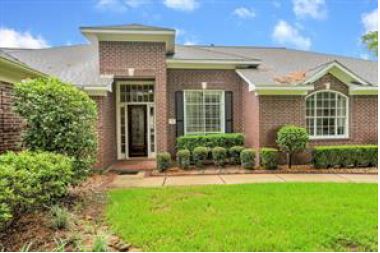
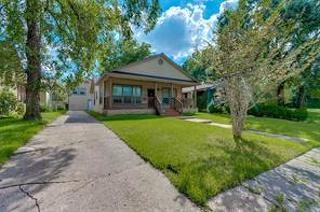
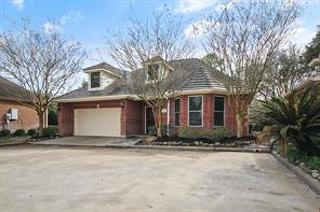
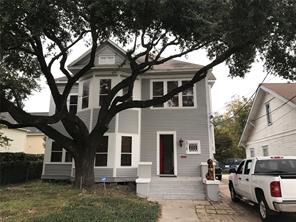
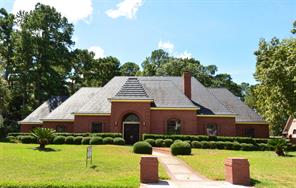
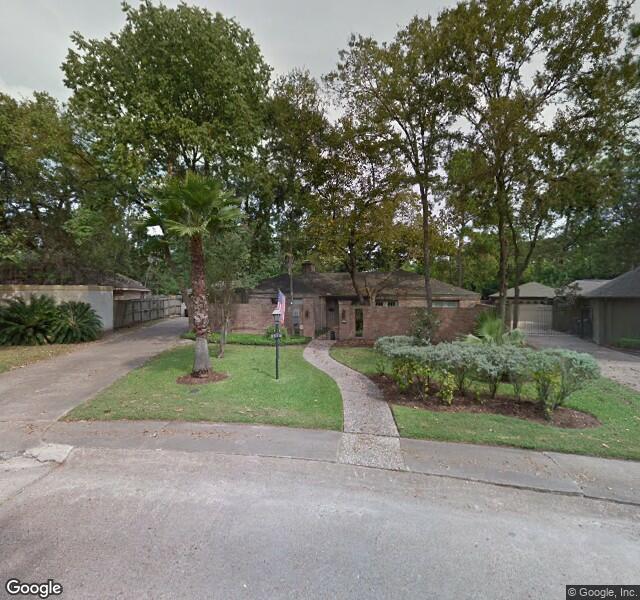
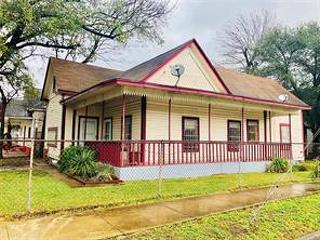
Property Details |
||
Property Type: |
Single-Family |
|
Bed(s): |
3 |
|
Full-Bath(s): |
2 |
|
Half-Bath(s): |
0 |
|
Building Sqft: |
1502 |
|
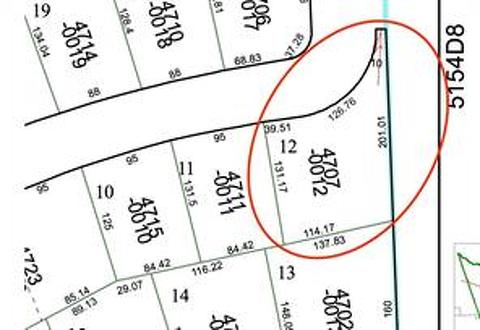
Lot Size: |
5000 |
|
Tax Rate: |
2.5264 |
|
County: |
Harris |
Listing Information |
|
List Price: |
$220,000 |
List Status: |
Sold |
MLS Number: |
89607319 |
Days on Market: |
261 |
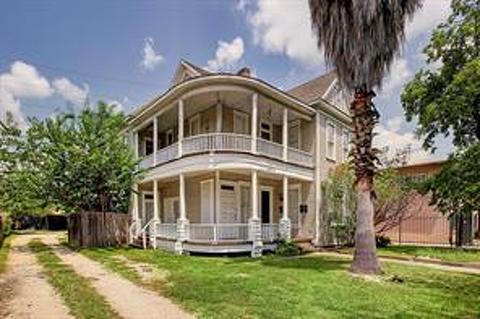
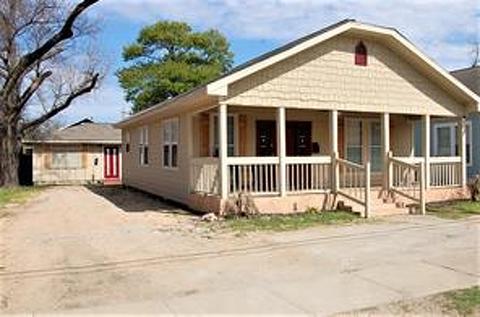
Great opportunity to invest in this 1930 Bungalow located in the very hot Northside neighborhood. Property is a few blocks from Hardy Yards development and minutes from Downtown & the Heights with Downtown views from front porch! New construction and development all around!