
Buy & Flip |
|
$23,889Net Profit |
14.21%ROI |
Total Cash Investment
Holding Period
Rehab/Renovation Costs
After Repair Value (ARV)
Financing Type
Risk Level
Net Profit
Annualized ROI
Return-On-Investment
Total Loan Cost
Monthly Loan Interest
Cost Per Month
Cost Per Week
Cost Per Day
Cost of Points
Monthly Expenses
Month |
Arv |
Total Cash Investment |
Net Profit |
Roi |
|---|---|---|---|---|
| 0 | $192,000 | $164,860 | $27,140 | 16.46% |
| 1 | $192,000 | $165,402 | $26,598 | 16.08% |
| 2 | $192,000 | $165,944 | $26,056 | 15.70% |
| 3 | $192,000 | $166,486 | $25,514 | 15.33% |
| 4 | $192,000 | $167,027 | $24,973 | 14.95% |
| 5 | $192,000 | $167,569 | $24,431 | 14.58% |
| 6 | $192,000 | $168,111 | $23,889 | 14.21% |
| 7 | $192,000 | $168,653 | $23,347 | 13.84% |
| 8 | $192,000 | $169,195 | $22,805 | 13.48% |
| 9 | $192,000 | $169,737 | $22,263 | 13.12% |
| 10 | $192,000 | $170,278 | $21,722 | 12.76% |
| 11 | $192,000 | $170,820 | $21,180 | 12.40% |
| 12 | $192,000 | $171,362 | $20,638 | 12.04% |
Disclaimer: This report is intended for general guidance and information purposes only. The report provides estimates of the potential earnings or... read more
Rental |
|
85.81%Cash-on-Cash Return Annually |
$0Avg. Cashflow Annually |
Total Investment
Point of Sale
Monthly Income
Monthly Expenses
Financing Type
Cash-on-Cash Return
Avg. Annual Cashflow
Appreciated Home Value
Total Net Cashflow
Total ROI at Sale
Equity
Monthly Payment
Total Amount Paid
Total Principal Paid
Total Interest Paid
Disclaimer: This report is intended for general guidance and information purposes only. The report provides estimates of the potential earnings or... read more
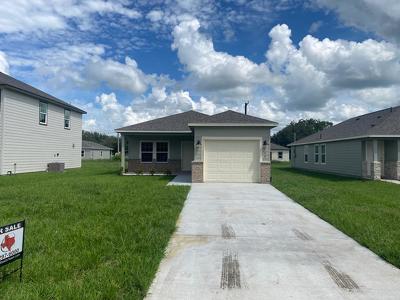
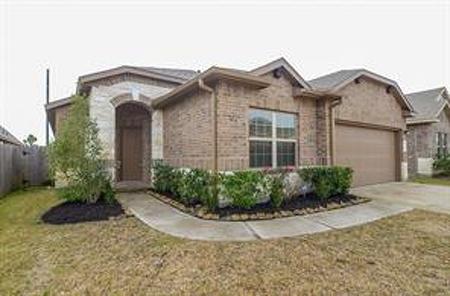
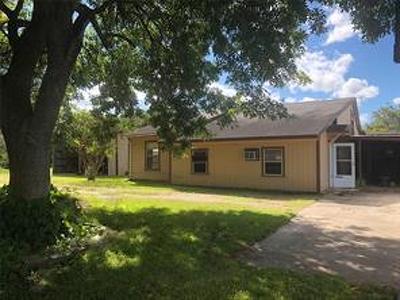
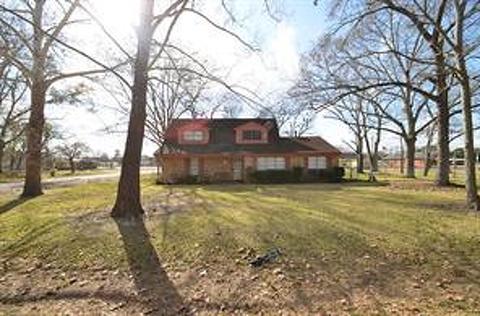
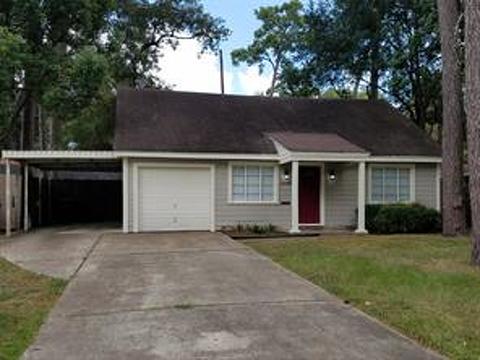
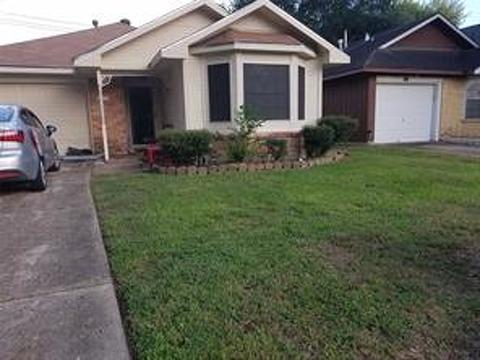
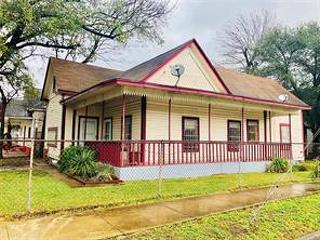
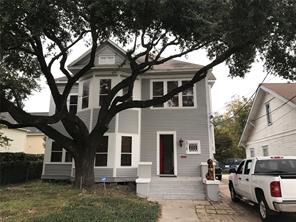
Property Details |
||
Property Type: |
Single-Family |
|
Bed(s): |
3 |
|
Full-Bath(s): |
2 |
|
Half-Bath(s): |
0 |
|
Building Sqft: |
1826 |
|
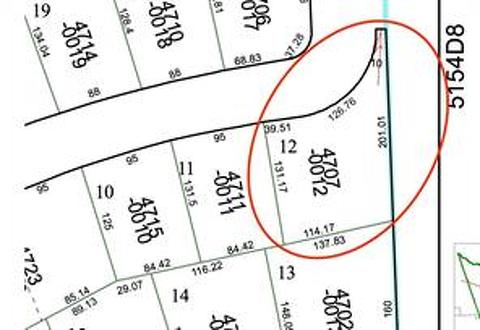
Lot Size: |
7659 |
|
Tax Rate: |
2.42448 |
|
County: |
Harris |
Listing Information |
|
List Price: |
$192,000 |
List Status: |
Not Listed |