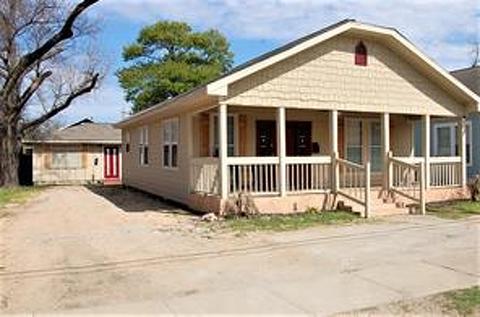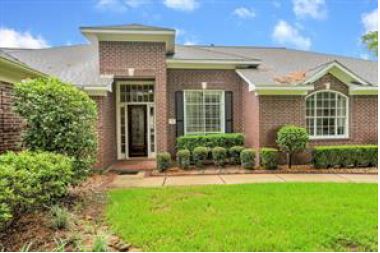
Buy & Flip |
|
$120,893Net Profit |
35.66%ROI |
Total Cash Investment
Holding Period
Rehab/Renovation Costs
After Repair Value (ARV)
Financing Type
Risk Level
Net Profit
Annualized ROI
Return-On-Investment
Total Loan Cost
Monthly Loan Interest
Cost Per Month
Cost Per Week
Cost Per Day
Cost of Points
Monthly Expenses
Month |
Arv |
Total Cash Investment |
Total Loan Cost |
Net Profit |
Roi |
|---|---|---|---|---|---|
| 0 | $480,000 | $333,200 | $5,347 | $141,453 | 42.45% |
| 1 | $480,000 | $334,176 | $7,797 | $138,027 | 41.30% |
| 2 | $480,000 | $335,152 | $10,248 | $134,600 | 40.16% |
| 3 | $480,000 | $336,128 | $12,699 | $131,173 | 39.02% |
| 4 | $480,000 | $337,104 | $15,149 | $127,747 | 37.90% |
| 5 | $480,000 | $338,080 | $17,600 | $124,320 | 36.77% |
| 6 | $480,000 | $339,056 | $20,051 | $120,893 | 35.66% |
| 7 | $480,000 | $340,032 | $22,501 | $117,467 | 34.55% |
| 8 | $480,000 | $341,009 | $24,952 | $114,039 | 33.44% |
| 9 | $480,000 | $341,985 | $27,402 | $110,613 | 32.34% |
| 10 | $480,000 | $342,961 | $29,853 | $107,186 | 31.25% |
| 11 | $480,000 | $343,937 | $32,304 | $103,759 | 30.17% |
| 12 | $480,000 | $344,913 | $34,754 | $100,333 | 29.09% |
Disclaimer: This report is intended for general guidance and information purposes only. The report provides estimates of the potential earnings or... read more
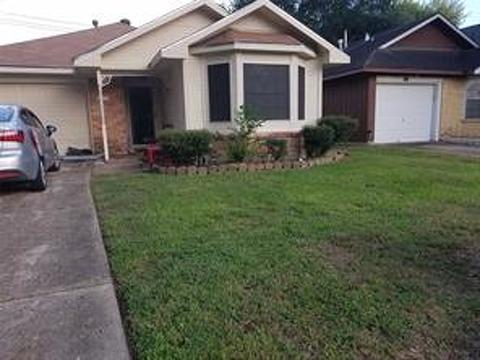
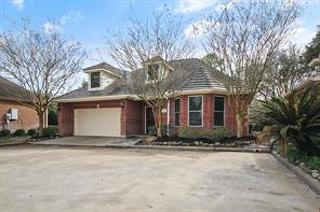
Buy & Flip |
|
$163,417Net Profit |
51.62%ROI |
Total Cash Investment
Holding Period
Rehab/Renovation Costs
After Repair Value (ARV)
Financing Type
Risk Level
Net Profit
Annualized ROI
Return-On-Investment
Total Loan Cost
Monthly Loan Interest
Cost Per Month
Cost Per Week
Cost Per Day
Cost of Points
Monthly Expenses
Month |
Arv |
Total Cash Investment |
Net Profit |
Roi |
|---|---|---|---|---|
| 0 | $480,000 | $311,700 | $168,300 | 53.99% |
| 1 | $480,000 | $312,514 | $167,486 | 53.59% |
| 2 | $480,000 | $313,328 | $166,672 | 53.19% |
| 3 | $480,000 | $314,141 | $165,859 | 52.80% |
| 4 | $480,000 | $314,955 | $165,045 | 52.40% |
| 5 | $480,000 | $315,769 | $164,231 | 52.01% |
| 6 | $480,000 | $316,583 | $163,417 | 51.62% |
| 7 | $480,000 | $317,396 | $162,604 | 51.23% |
| 8 | $480,000 | $318,210 | $161,790 | 50.84% |
| 9 | $480,000 | $319,024 | $160,976 | 50.46% |
| 10 | $480,000 | $319,838 | $160,162 | 50.08% |
| 11 | $480,000 | $320,651 | $159,349 | 49.70% |
| 12 | $480,000 | $321,465 | $158,535 | 49.32% |
Disclaimer: This report is intended for general guidance and information purposes only. The report provides estimates of the potential earnings or... read more
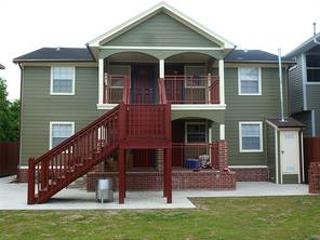
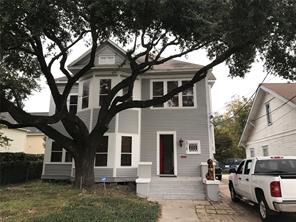
Buy & Flip |
|
$162,446Net Profit |
54.18%ROI |
Total Cash Investment
Holding Period
Rehab/Renovation Costs
After Repair Value (ARV)
Financing Type
Risk Level
Net Profit
Annualized ROI
Return-On-Investment
Total Loan Cost
Monthly Loan Interest
Cost Per Month
Cost Per Week
Cost Per Day
Cost of Points
Monthly Expenses
Month |
Arv |
Total Cash Investment |
Total Loan Cost |
Net Profit |
Roi |
|---|---|---|---|---|---|
| 0 | $480,000 | $294,800 | $4,730 | $180,470 | 61.22% |
| 1 | $480,000 | $295,636 | $6,898 | $177,466 | 60.03% |
| 2 | $480,000 | $296,472 | $9,066 | $174,462 | 58.85% |
| 3 | $480,000 | $297,308 | $11,234 | $171,458 | 57.67% |
| 4 | $480,000 | $298,144 | $13,402 | $168,454 | 56.50% |
| 5 | $480,000 | $298,980 | $15,570 | $165,450 | 55.34% |
| 6 | $480,000 | $299,816 | $17,738 | $162,446 | 54.18% |
| 7 | $480,000 | $300,652 | $19,906 | $159,442 | 53.03% |
| 8 | $480,000 | $301,489 | $22,074 | $156,437 | 51.89% |
| 9 | $480,000 | $302,325 | $24,242 | $153,433 | 50.75% |
| 10 | $480,000 | $303,161 | $26,410 | $150,429 | 49.62% |
| 11 | $480,000 | $303,997 | $28,578 | $147,425 | 48.50% |
| 12 | $480,000 | $304,833 | $30,746 | $144,421 | 47.38% |
Disclaimer: This report is intended for general guidance and information purposes only. The report provides estimates of the potential earnings or... read more
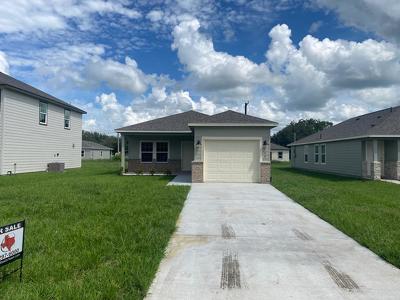
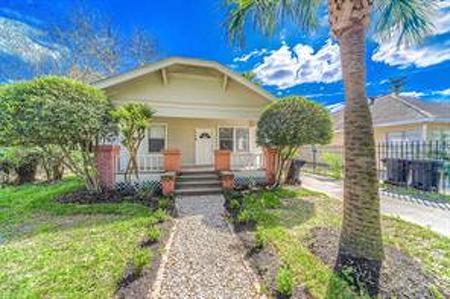
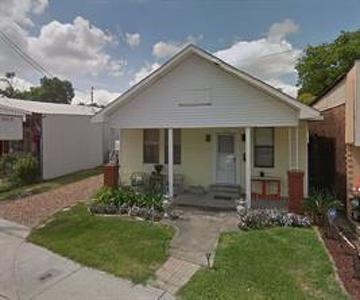
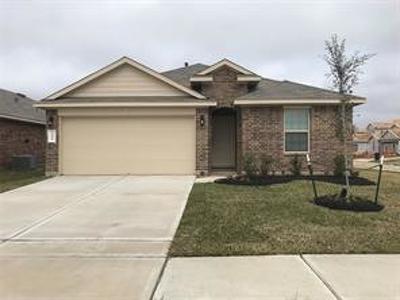
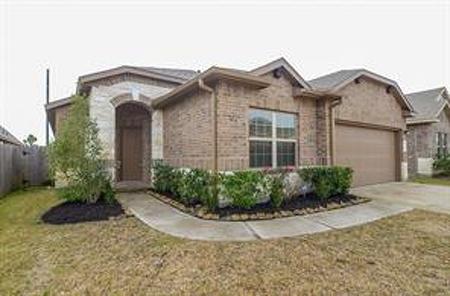
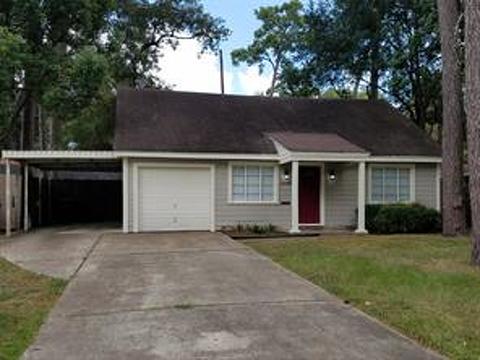
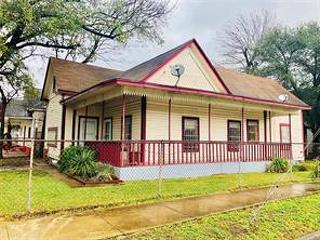
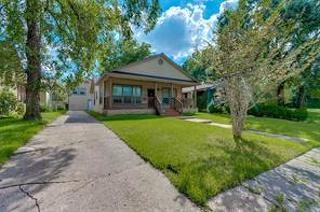
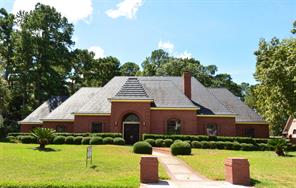
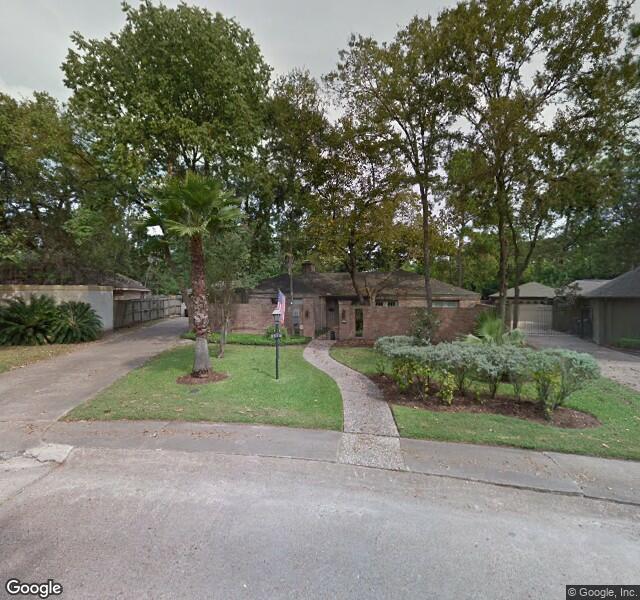
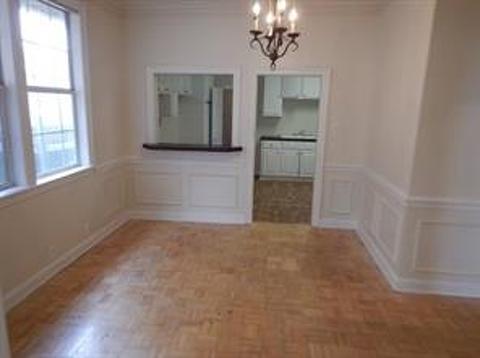
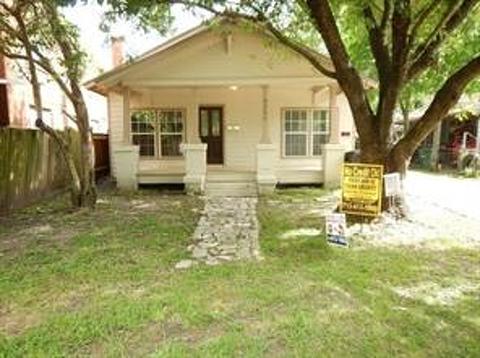
Property Details |
||
Property Type: |
Single-Family |
|
Bed(s): |
3 |
|
Full-Bath(s): |
1 |
|
Half-Bath(s): |
0 |
|
Building Sqft: |
||
Lot Size: |
5000 |
|
Tax Rate: |
2.6764 |
|
County: |
Harris |
Listing Information |
|
List Price: |
$219,727 |
List Status: |
Sold |
MLS Number: |
23419032 |
Days on Market: |
309 |
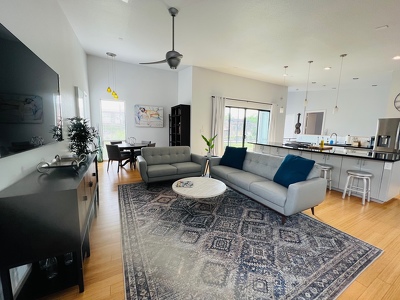
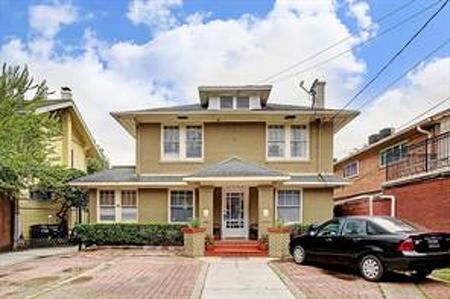
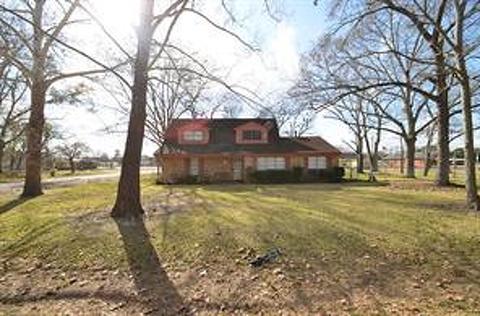
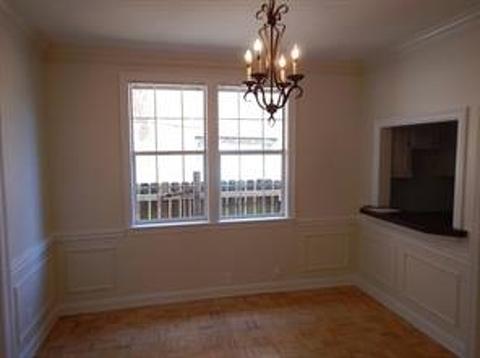
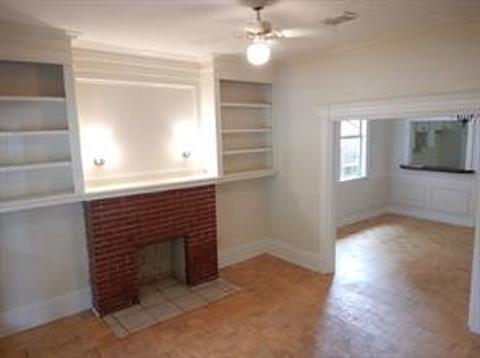
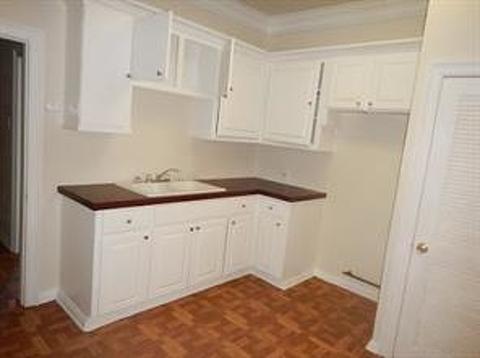
This craftsman style home is located in the heart of Houston with easy access to Downtown. Features include wood flooring and built in shelves over a brick exposed fireplace to enjoy those cozy nights in. It invites you in with its high ceilings and crown molding, if you love that eclectic feel. Adding to its character, it also comes with new updates such as a completely redone driveway, new paint inside and out, Central A/C and an updated kitchen with and bathroom with lovely granite tile. This could be the home for you!