Buy & Flip |
|
$118,386Net Profit |
37.96%ROI |
Total Cash Investment
Holding Period
Rehab/Renovation Costs
After Repair Value (ARV)
Financing Type
Risk Level
Net Profit
Annualized ROI
Return-On-Investment
Total Loan Cost
Monthly Loan Interest
Cost Per Month
Cost Per Week
Cost Per Day
Cost of Points
Monthly Expenses
Month |
Arv |
Total Cash Investment |
Total Loan Cost |
Net Profit |
Roi |
|---|---|---|---|---|---|
| 0 | $450,000 | $307,685 | $4,934 | $137,381 | 44.65% |
| 1 | $450,000 | $308,384 | $7,401 | $134,215 | 43.52% |
| 2 | $450,000 | $309,083 | $9,868 | $131,049 | 42.40% |
| 3 | $450,000 | $309,781 | $12,335 | $127,884 | 41.28% |
| 4 | $450,000 | $310,480 | $14,802 | $124,718 | 40.17% |
| 5 | $450,000 | $311,179 | $17,269 | $121,552 | 39.06% |
| 6 | $450,000 | $311,878 | $19,736 | $118,386 | 37.96% |
| 7 | $450,000 | $312,576 | $22,204 | $115,220 | 36.86% |
| 8 | $450,000 | $313,275 | $24,671 | $112,054 | 35.77% |
| 9 | $450,000 | $313,974 | $27,138 | $108,888 | 34.68% |
| 10 | $450,000 | $314,673 | $29,605 | $105,722 | 33.60% |
| 11 | $450,000 | $315,371 | $32,072 | $102,557 | 32.52% |
| 12 | $450,000 | $316,070 | $34,539 | $99,391 | 31.45% |
Disclaimer: This report is intended for general guidance and information purposes only. The report provides estimates of the potential earnings or... read more
Rental |
|
53.28%Cash-on-Cash Return Annually |
$4,102Avg. Cashflow Annually |
Total Investment
Point of Sale
Monthly Income
Monthly Expenses
Financing Type
Cash-on-Cash Return
Avg. Annual Cashflow
Appreciated Home Value
Total Net Cashflow
Total ROI at Sale
Disclaimer: This report is intended for general guidance and information purposes only. The report provides estimates of the potential earnings or... read more
Rental |
|
65.05%Cash-on-Cash Return Annually |
$6,598Avg. Cashflow Annually |
Total Investment
Point of Sale
Monthly Income
Monthly Expenses
Financing Type
Cash-on-Cash Return
Avg. Annual Cashflow
Appreciated Home Value
Total Net Cashflow
Total ROI at Sale
Disclaimer: This report is intended for general guidance and information purposes only. The report provides estimates of the potential earnings or... read more
Rental |
|
8.2%Cash-on-Cash Return Annually |
$1,883Avg. Cashflow Annually |
Total Investment
Point of Sale
Monthly Income
Monthly Expenses
Financing Type
Cash-on-Cash Return
Avg. Annual Cashflow
Appreciated Home Value
Total Net Cashflow
Total ROI at Sale
Equity
Monthly Payment
Total Amount Paid
Total Principal Paid
Total Interest Paid
Disclaimer: This report is intended for general guidance and information purposes only. The report provides estimates of the potential earnings or... read more
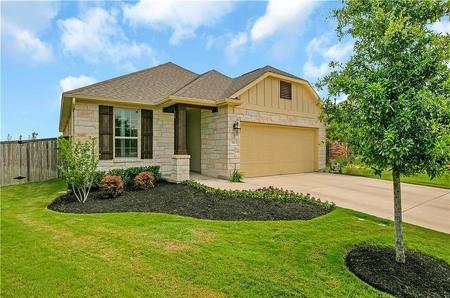
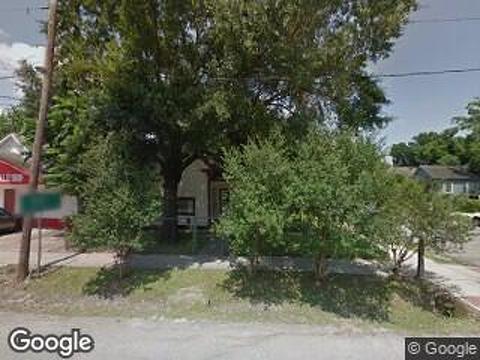
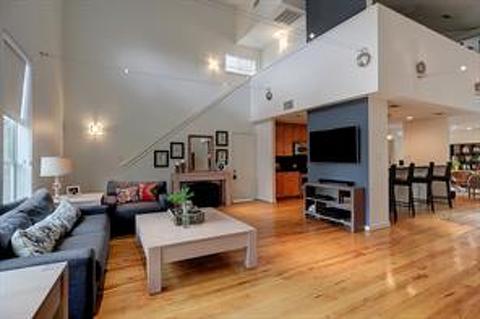
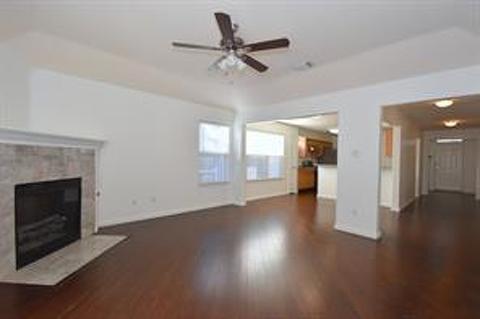
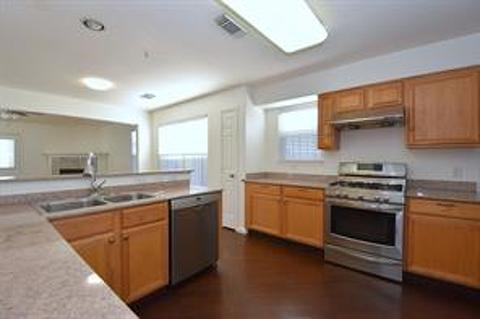
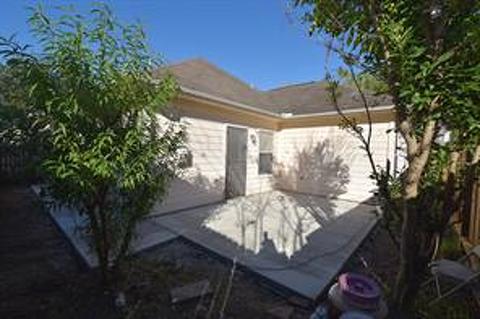
Property Details |
||
Property Type: |
Single-Family |
|
Bed(s): |
3 |
|
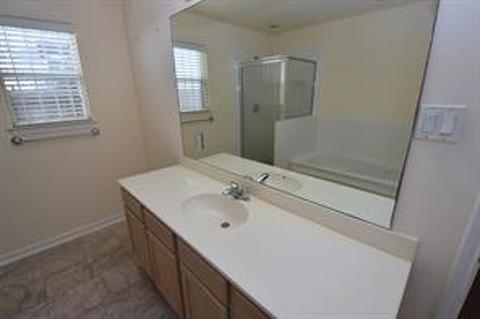
Full-Bath(s): |
2 |
|
Half-Bath(s): |
0 |
|
Building Sqft: |
1750 |
|
Lot Size: |
4327 |
|
Tax Rate: |
2.7496 |
|
County: |
Harris |
Listing Information |
|
List Price: |
$239,399 |
List Status: |
Sold |
MLS Number: |
97182504 |
Days on Market: |
83 |
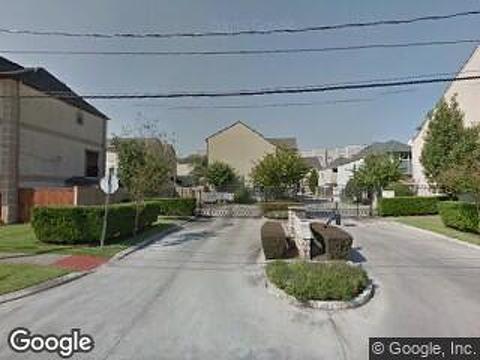
Freshly UPDATED 3-bed, 2-bath home situated in the heart of Chinatown in a gated community. Home comes with engineered hard wood throughout, granite counter tops. Easy access Beltway 8, Hwy 59, and Westpark Toll. Nestled in a quiet neighborhood but steps from infamous restaurants and markets that Chinatown has to offer. Walking to Owen Intermediate and Saigon Plaza (Kim Son Buffet and many restaurants). Current Fridge, Washer, and Dryer included in the sale. This gated neighborhood rarely has any house for sale because it's very stable.